ntopng is an open-source (GPLv3) network traffic analyzer which provides a web interface for real-time network traffic monitoring. It runs on multiple platforms including Linux and MacOS X. ntopng comes with a simple RMON-like agent with built-in web server capability, and uses Redis-backed key-value server to store time series statistics. You can install ntopng network traffic analyzer on any designated monitoring server connected to your network, and use a web browser to access real-time traffic reports available on the server.
In this tutorial, I will describe how to set up a web-based network traffic monitoring system on Linux by using ntopng.
Features of ntopng
- Flow-level, protocol-level real-time analysis of local network traffic.
- Domain, AS (Autonomous System), VLAN level statistics.
- Geolocation of IP addresses.
- Deep packet inspection (DPI) based service discovery (e.g., Google, Facebook).
- Historical traffic analysis (e.g., hourly, daily, weekly, monthly, yearly).
- Support for sFlow, NetFlow (v5/v9) and IPFIX through nProbe.
- Network traffic matrix (who�s talking to who?).
- IPv6 support.
Install ntopng on Linux
The official website offers binary packages for Ubuntu and CentOS. So if you use either platform, you can install these packages.If you want to build the latest ntopng from its source, follow the instructions below.
To build ntopng on Debian, Ubuntu or Linux Mint:
$ sudo apt-get install libpcap-dev libglib2.0-dev libgeoip-dev redis-server wget
$ tar xzf ntopng-1.0.tar.gz -C ~
$ cd ~/ntopng-1.0/
$ ./configure
$ make geoip
$ make
In the above steps, �make geoip� will automatically download a free version of GeoIP databases with wget from maxmind.com. So make sure that your system is connected to the network.$ tar xzf ntopng-1.0.tar.gz -C ~
$ cd ~/ntopng-1.0/
$ ./configure
$ make geoip
$ make
To build ntopng on Fedora:
$ sudo yum install libpcap-devel glib2-devel GeoIP-devel
libxml2-devel redis wget
$ tar xzf ntopng-1.0.tar.gz -C ~
$ cd ~/ntopng-1.0/
$ ./configure
$ make geoip
$ make
To install ntopng on CentOS or RHEL, first set up EPEL repository, and then follow the same instructions as in Fedora above.libxml2-devel redis wget
$ tar xzf ntopng-1.0.tar.gz -C ~
$ cd ~/ntopng-1.0/
$ ./configure
$ make geoip
$ make
Configure ntopng on Linux
After building ntopng, create a configuration directory for ntopng, and prepare default configuration files as follows. I assume that �192.168.1.0/24? is the CIDR address prefix of your local network.$ sudo mkir /etc/ntopng -p
$ sudo -e /etc/ntopng/ntopng.start
--local-networks "192.168.1.0/24"
--interface 1
$ sudo -e /etc/ntopng/ntopng.conf
-G=/var/run/ntopng.pidBefore running ntopng, make sure to first start redis, which is a key-value store for ntopng.
To start ntopng on Debian, Ubuntu or Linux Mint:
$ sudo /etc/init.d/redis-server restart
$ cd ~/ntopng-1.0/
$ sudo ./ntopng
To start ntopng on Fedora, CentOS or RHEL:$ cd ~/ntopng-1.0/
$ sudo ./ntopng
$ sudo service redis restart
$ cd ~/ntopng-1.0/
$ sudo ./ntopng
By default, ntopng listens on TCP/3000 port. Verify this is the case using the command below.$ cd ~/ntopng-1.0/
$ sudo ./ntopng
$ sudo netstat -nap|grep ntopng
tcp 0 0 0.0.0.0:3000 0.0.0.0:* LISTEN 29566/ntopng
Monitor Network Traffic in Web-Based Interface
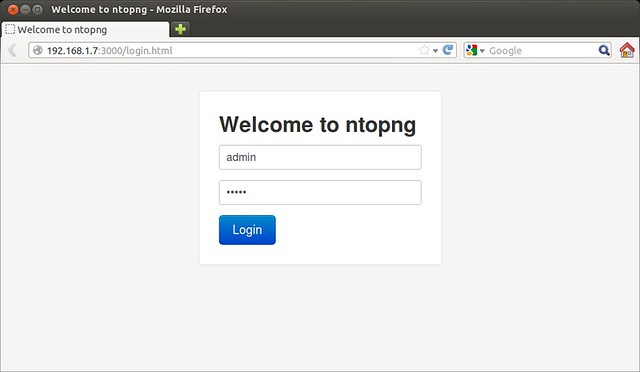
Once ntopng is successfully running, go to http://<ip-address-of-host>:3000 on your web browser to access the web interface of ntopng.You will see the login screen of ntopng. Use the default username and password: �admin/admin� to log in.
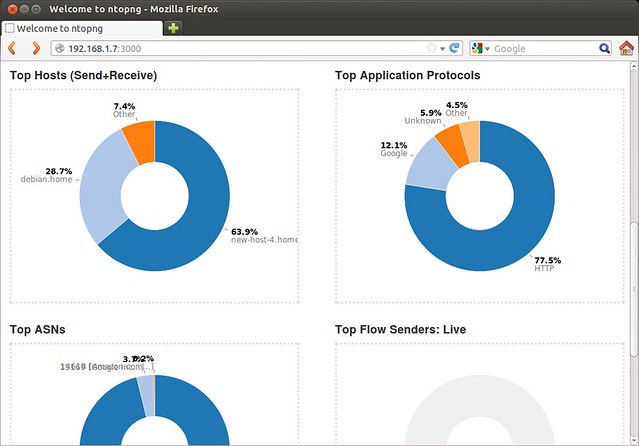
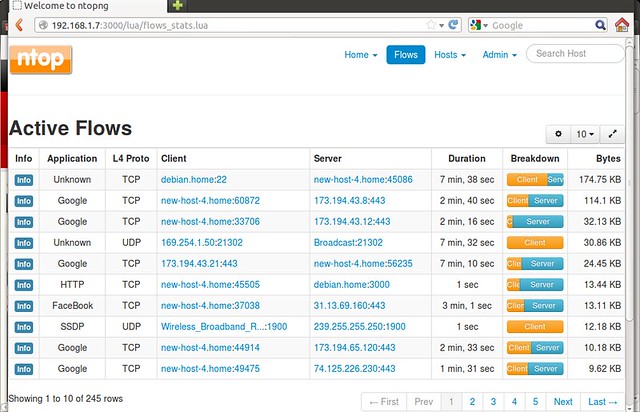
Here are a few screenshots of ntopng in action.
Real-time visualization of top flows.

Live statistics of top hosts, top protocols and top AS numbers.
Real time report of active flows with DPI-based automatic application/service discovery.
Historic traffic analysis.

http://xmodulo.com/2013/10/set-web-based-network-traffic-monitoring-linux.html
No comments:
Post a Comment