In this tutorial, I will describe how to create flowchart or diagram with yEd graph editor on Linux.
yEd is an extremely easy-to-use, yet feature-rich diagram editor written in Java. Using yEd, you can create flowcharts, BPMN/UML diagrams, organizational charts, or any kind of graphs containing nodes and edges. It also features many sophisticated layout generation algorithms built-in, which allow you to test alternative layouts of created diagrams or graphs with a single button click.
Install yEd on Linux
yEd is a standalone Java application whose JAR file is freely downloadable from its website. So you can run yEd on any platform which has Java Run Time (JRE) installed. Assuming that you downloaded yEd zip file and have JRE installed on your Linux, you can install yEd as follows.$ sudo unzip yEd-3.11.1.zip -d /opt
Then create a script named yed in /usr/bin directory, which launches JVM as shown below.$ sudo vi /usr/bin/yed
#!/bin/shNext, make the script executable.
java -jar /opt/yed-3.11.1/yed.jar
$ sudo chmod +x /usr/bin/yed
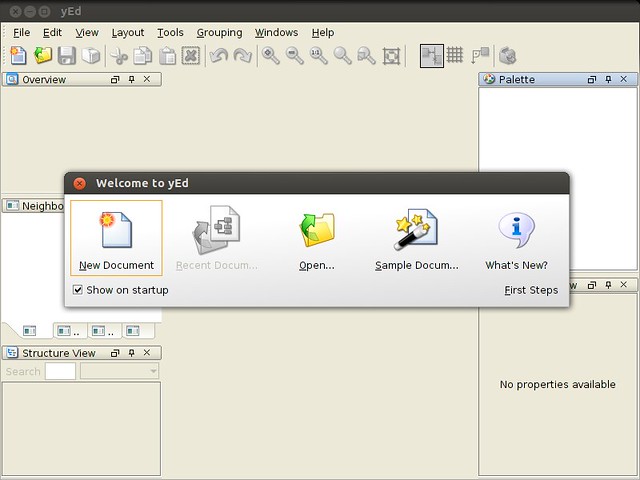
Now you can launch yEd editor simply by running the script as follows.$ yed
If you want, you can also create a desktop shortcut for yEd with the following information.- Name: yEd
- Command: java -jar /opt/yed-3.11.1/yed.jar
- Icon: /opt/yed-3.11.1/icons/yicon32.png
Draw a Diagram with yEd
yEd allows you to create any kind of diagram in a snap. You will see a "palette" window in the right sidebar, which shows a variety of nodes and edges to choose from. For example, I created the following network diagram in less than ten minutes.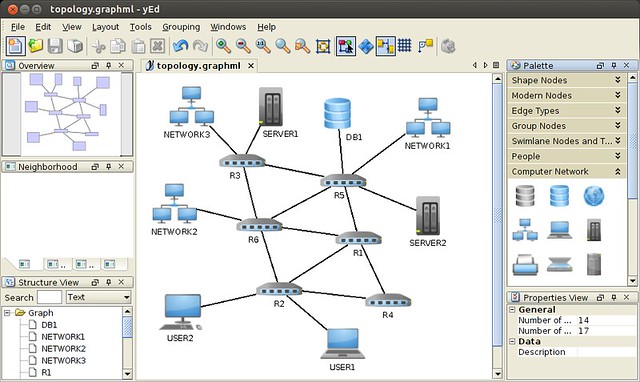
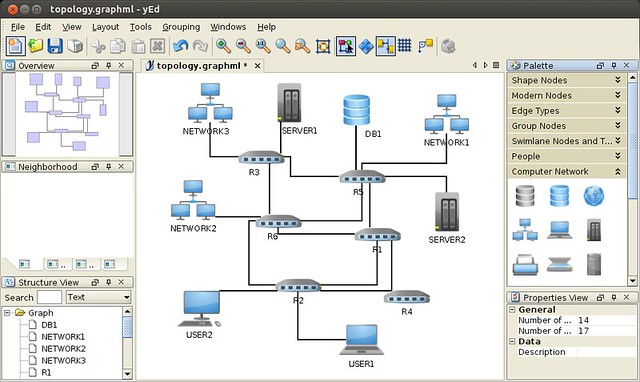
Once you create a diagram, you can try yEd's built-in layout algorithms to automatically transform the diagram into different layouts. For example, I tried regenerating the original layout as follows.
Layout #1: Edge routing - orthogonal bus style

Layout #2: Edge routing - orthogonal channel
Layout #3: Circular

Draw a Flowchart with yEd
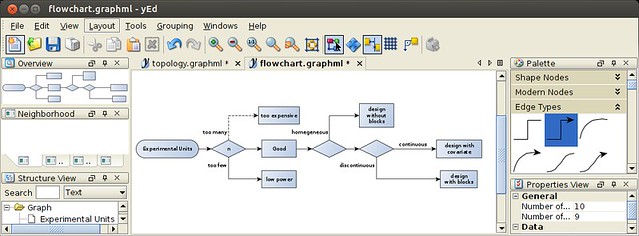
Besides diagrams, you can also draw flowcharts as easily. For example:
Once you create a flowchart, you can also explore various flowchart layouts. For example, you can change the orientation of the flowchart from vertical to horizontal as follows.
Draw a Generic Graph with yEd
yEd has built-in templates for various graph types: grid, tree, planar and random graphs. For example, if you want to generate a tree graph, you can instantly create one by entering the number of nodes, fan out, and tree depth as follows.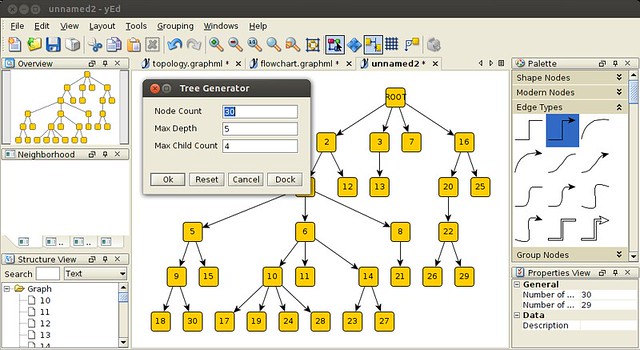
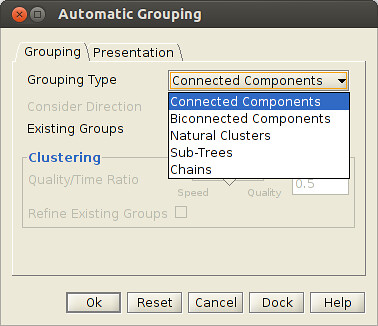
Among a number of other features, yEd has automatic grouping feature, where you can group individual components in automatic fashions. This is convenient when you are dealing with so many different components in your diagram.
Once you are done with editing a flowchart or diagram, you can save it to a file. By default, yEd saves a current layout in GraphML format which is an XML-based textual file format for graphs. So you can manually edit or version control yEd files easily. If you want, you can export it to various image formats including png, jpg, gif, eps, pdf and svg.
http://xmodulo.com/2013/11/draw-flowchart-diagram-linux.html
No comments:
Post a Comment